Fig. 5.
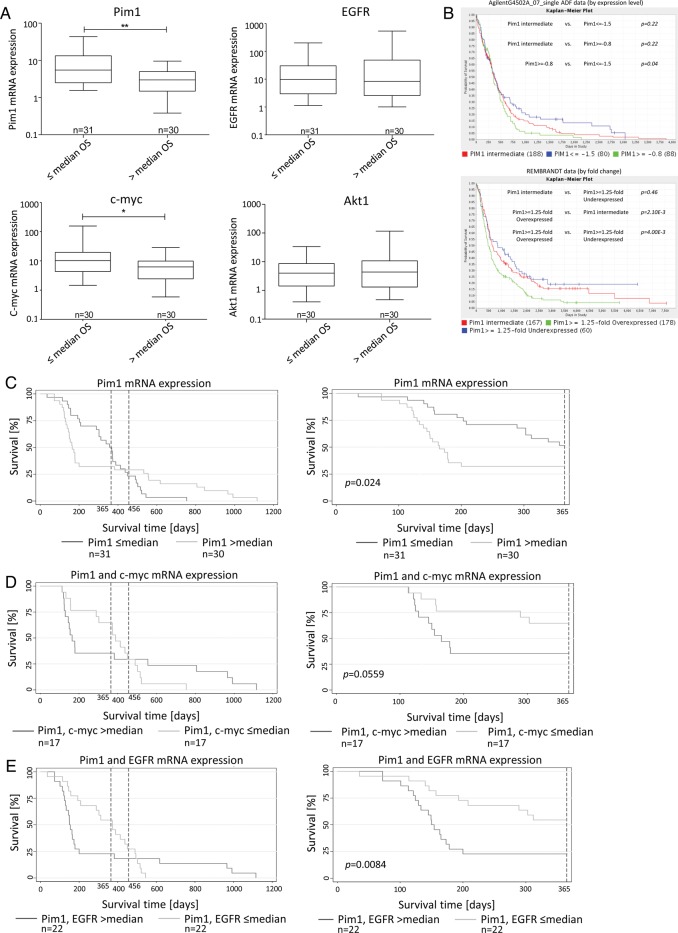
Association between Pim1 mRNA or protein expression and survival time of patients with GBM. (A) mRNA expression of Pim1, c-myc, EGFR, and Akt1 was determined with quantitative real-time (RT-)PCR. Patients wer divided into 2 subgroups according to their OS time: patients with survival equal to or below the median time (≤ median OS) vs patients with survival above the median time (> median OS). Box plots represent the median mRNA expression as horizontal bars as well as the 5th and 95th percentiles, Mann–Whitney U test. (B) Screening of TCGA (caINTEGRATOR2_V1_4_RC2) for an association between Pim1 gene expression and survival of patients with GBM. Kaplan–Meier survival curves of AgilentG4502A_07_single ADF data (at the top) and of REMBRANDT data (at the bottom), both based on microarray analyses. Green lines: Pim1 overexpressing patients; blue lines: Pim1 underexpressing patients; red lines: Pim1 intermediate expressing patients. (C–E) Kaplan–Meier survival curves for patients with GBM based on their Pim1 mRNA expression (C), Pim1 and c-myc mRNA expression (D), and Pim1 and EGFR expression (E). Patients were divided into 2 subgroups depending on gene expression as determined by quantitative RT-PCR. Left panels represent the complete patient cohort, right panels demonstrate survival data for a 365-day observation time span. The broken vertical lines denote the current survival times (12 and 15 mo) of patients with GBM treated with standard therapy (surgical removal, combined radio- and chemotherapy). *P < .05, **P < .005.

