Fig. 6.
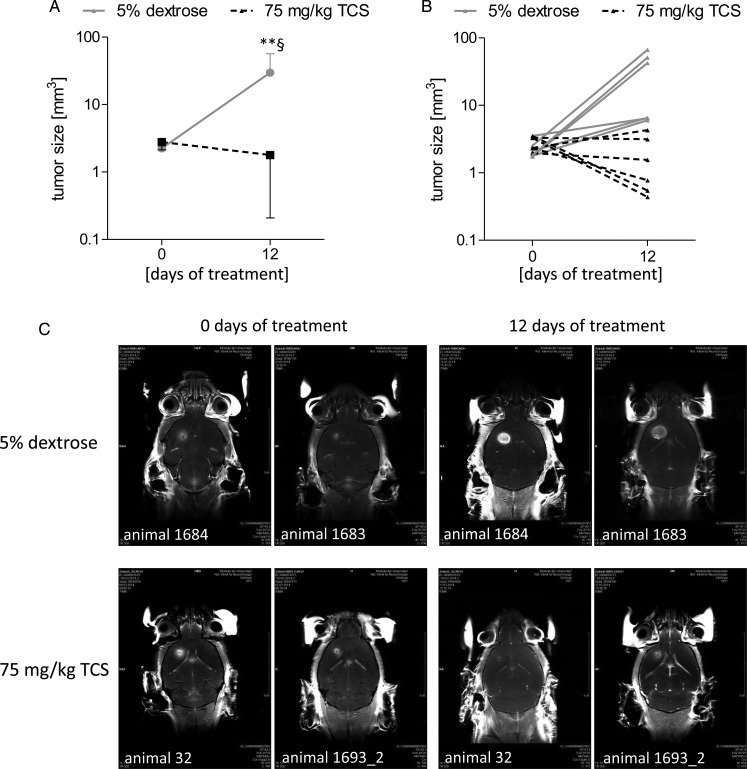
Analysis of Pim1 as a therapeutic target in an orthotopic in vivo mouse model. Female wild-type C57BL/6 mice were immobilized in a stereotactic head holder in the flatskull position; 1 μL (2.5 × 10⁴ cells/μL) of GL261 cells in PBS was inserted 1 mm anterior and 2 mm lateral to bregma to a depth of 3 mm from the dural surface. Twelve days postinjection tumor development was assessed in isoflurane-anesthetized mice by MRT to start the treatment at a tumor volume >1.5 mm3. Tumor volume was calculated with OsiriX software in coronar and axial gadolinium-enhanced T1-sections. Afterward, mice were treated with either 5% dextrose (control animals, n = 5) or 75 mg/kg TCS (n = 5) as Pim1 inhibitor every second day by oral gavage until the end of the study (12 d treatment). Tumor size was measured using MRT 12 days after starting the treatment. (A) Mean value of tumor size of control (5% dextrose) and TCS-treated animals at the day of beginning the pharmacological intervention (day 0) and at day 12. (B) Tumor sizes of each individual animal from the control and TCS-treated group at the day of beginning pharmacological intervention (day 0) and at day 12. (C) Representative gadobutrol-enhanced T1-weighted images (coronar) for 2 animals of the control (5% dextrose) and the TCS-treated group at the day of beginning pharmacological intervention (day 0) and at day 12. **P < .01 vs TCS treated animals (day 12) and §P < .05 vs the respective day 0 group.

