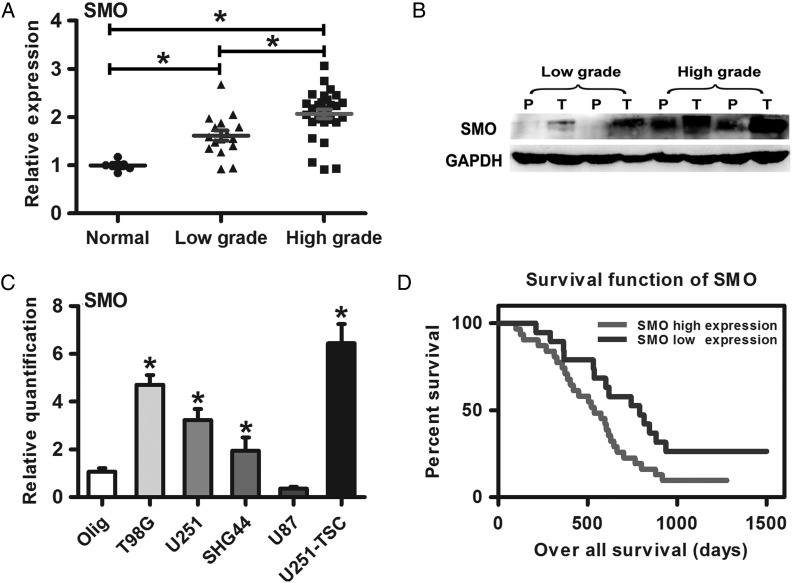
Fig. 1.
SMO expression in glioma specimens and cell lines correlated with poor survival. (A) SMO expression in glioma specimens and normal brain tissues as assessed by qRT-PCR. (B) SMO expression in different grade gliomas between peritumor tissues and tumor tissues by Western blot assay. (C) qRT-PCR analysis showed T98G, SHG44, U251, and U251-TSC glioma cells expressed higher levels of SMO than the Olig cell line. The data represent mean ± SE of 3 replicates (*P < .05). (D) Kaplan–Meier survival curves indicating cumulative survival as a function of time for those patients with SMO high expression versus low expression. The patients with high SMO expression experienced a significantly worse outcome (*P < .05).

