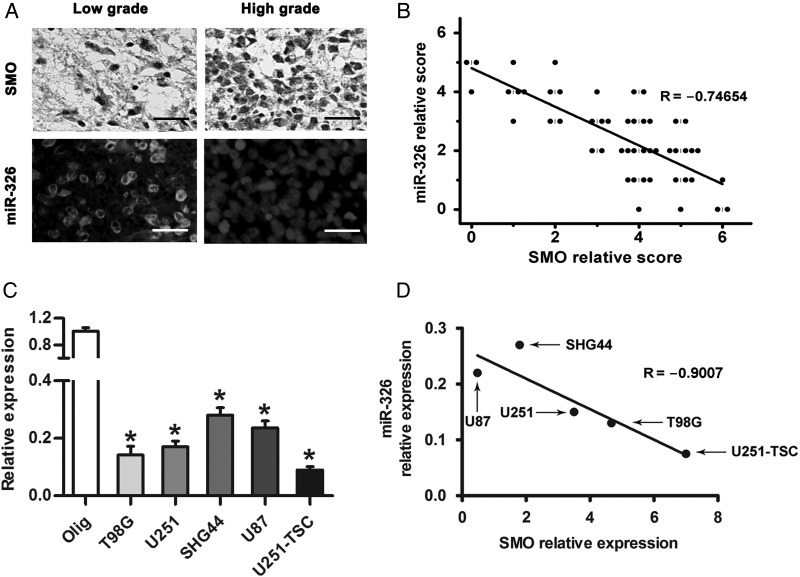
Fig. 3.
SMO expression was inversely correlated with miR-326 expression in glioma. (A) The expression of SMO and miR-326 in glioma specimens was assessed by IHC and FISH (scale bars, 20 µm). (B) Spearman's correlation analysis was used to determine the correlation between the expression-level scores of SMO and miR-326 (Spearman's correlation analysis, r = −0.74654, P < .001). (C) qRT-PCR analysis showed that T98G, U87, U251, SHG44, and U251-TSC glioma cells expressed low levels of miR-326 compared with Olig. The data represent mean ± SE of 3 replicates (*P < .05). (D) A plot of the linear inverse correlation between the expression of SMO and miR-326 expression in U87, T98, U251, SHG44, and U251-TSC cells (P < .05, linear correlation r = −0.9007).

