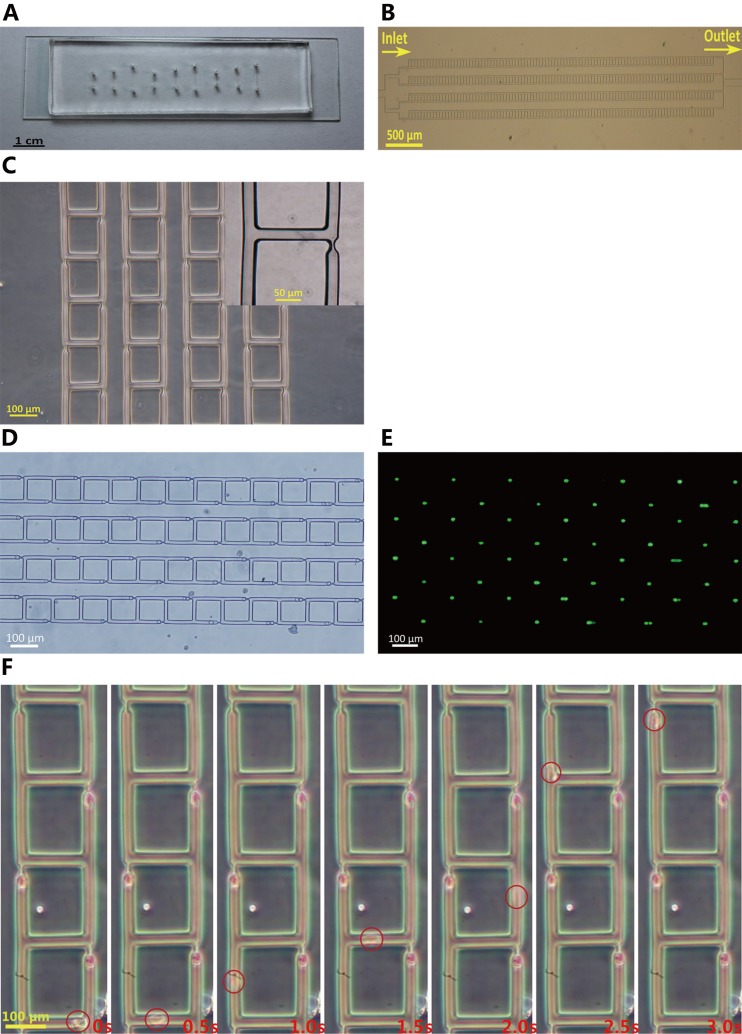
FIG. 4.
Single cell trapping experimental results. (a) A picture of the micro-fabricated PDMS micro-device (array 2). The PDMS layer was reversibly pasted onto the glass slide by degassing. (b) Microscopic picture of the single cell trapping array (array 2), featured with symmetrical microfluidic channel networks and microarrays of traps. The four channels are connected in parallel to a common inlet and outlet. (c) Zoom-in view of the microarray (array 2). (d) Bright-field microscopic image of cells trapped in the constrictions (array 1). Cells are on average of 13 μm in diameter. (e) Fluorescent microscopy image of the same cells (array 1) shown in (d). The green dots represent single cells trapped on site. (f) Time-elapsed view of trapping of a single cell (array 1).

