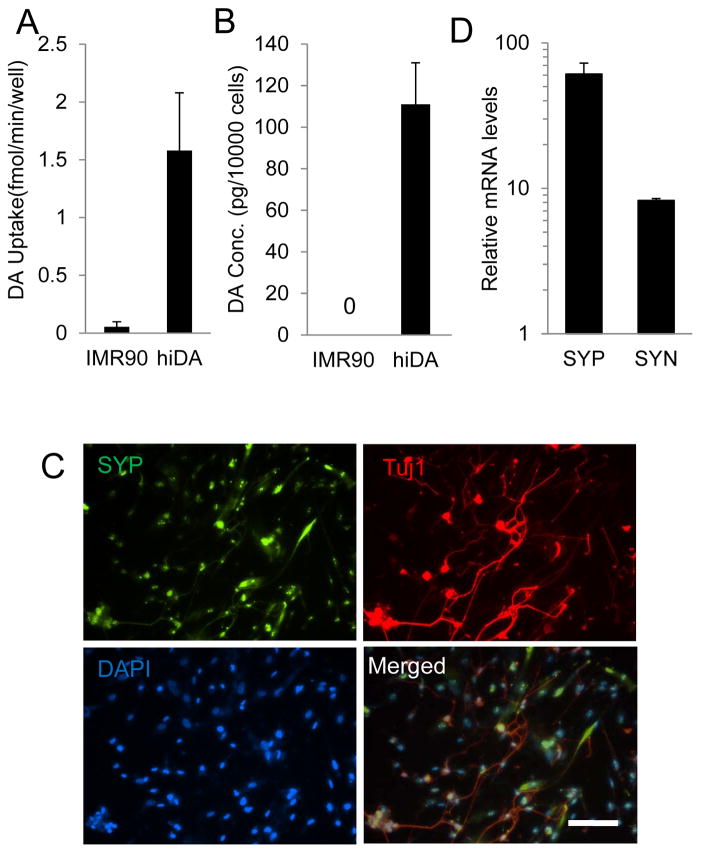
Figure 4. Functional characterization of hiDA cells.
A. Dopamine uptake of hiDA neurons. The specific [3H]DA uptake was detected 5F+p53-DN transduced IMR90 cells at day 24 after transduction. Error bars indicate standard error of the mean (SEM, n=4).
B. Dopamine release of hiDA neurons.
C. SYP (synaptophysin) co-expression with Tuj1 in 5F+p53-DN transduced IMR90 cells at 20 days after gene transduction. The scale bar represents 200 μm.
D. Quantitative PCR analysis SYP (synaptophysin) and SYN gene expression in 5F+p53-DN transduced IMR90 cells at 20 days after gene transduction.

