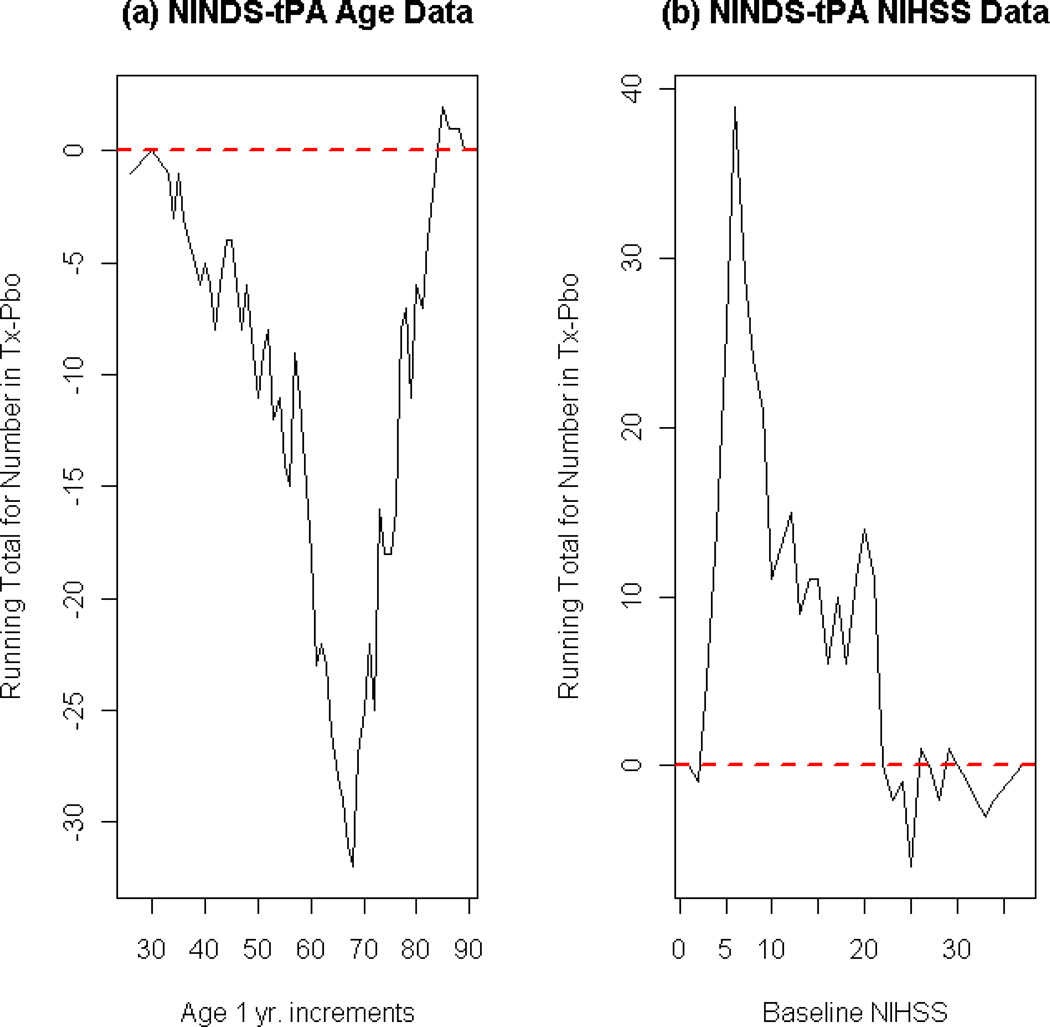
Figure 1. Baseline covariate imbalances in NINDS tPA dataset.
These plots represent the cumulative sum of imbalance as measured by the difference in the number of subjects in each treatment groups at each level of the respective covariate. Let F(x,j) be the number of subjects randomized to treatment arm j (j = 1,2) with the covariate value less than or equal to x. Then these plots illustrate D(x)=F(x,1)−F(x,2), the distribution of cumulative imbalances between the two treatment arms. Ideally, the curve of D(x) would frequently cross the zero (red, dotted) line in the entire range of the covariate, indicating a nearly balanced distribution of that covariate between the two treatment arms. (Tx: Treatment group receiving tPA, Pbo: Placebo group). (a)Cumulative sum of imbalances by level of age (1 year increments). Older subjects were assigned to treatment group. (b)Cumulative sum of imbalances by level of baseline NIHSS, which ranges from 0 to 42. Subjects with less severe strokes were assigned to treatment (tPA) group.

