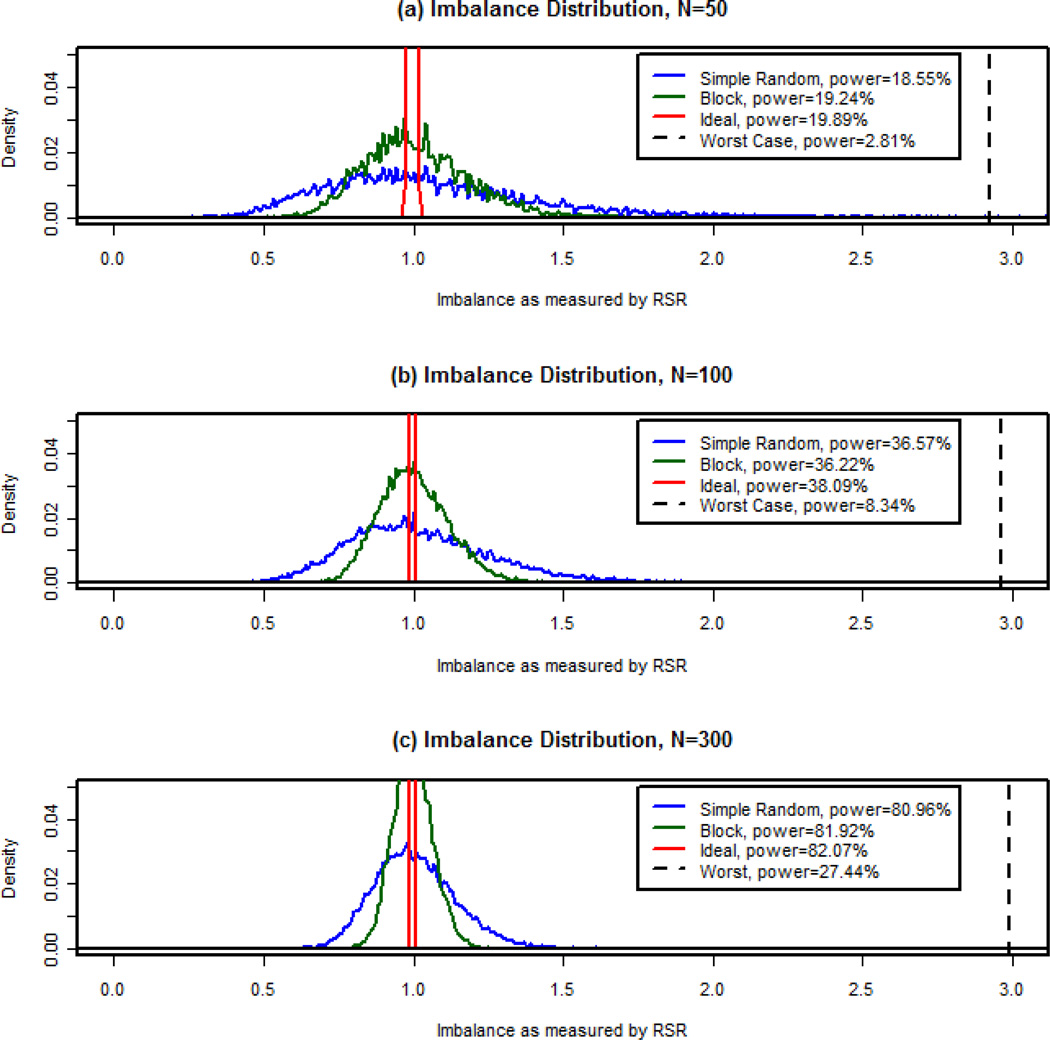
Figure 4. Distribution of imbalance.
These plots show the empirical probability densities for the imbalance measurement as determined by the RSR (rank-sum ratio) for each simulated allocation scenario (simple random allocation, blocked, ideal, and worst case) based on 10,000 simulations. The estimated power for the main effect of treatment is shown in the legend for each scenario. Sample sizes of (a)50, (b)100, and (c)300 are shown here.

