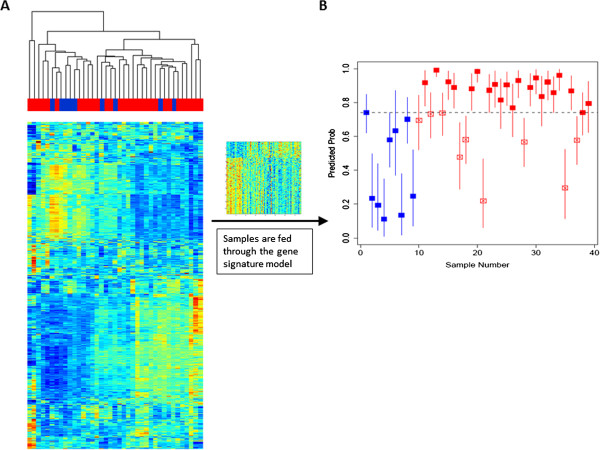
Figure 6.

Validation testing. (A) Unsupervised hierarchical clustering of the validation set, includes 9 peripheral blood samples from normal subjects (black) and 30 samples from IPF subjects (red). (B) Each sample from the validation set is assigned a probability of IPF, and a credible interval to that value (solid bars), by Bayesian modeling to the gene signature. Normal subjects (blue) tend to receive low probability scores while IPF subjects (red) tend to receive high probability scores. The optimal threshold for this test was determined by the Youden index (dotted line).
