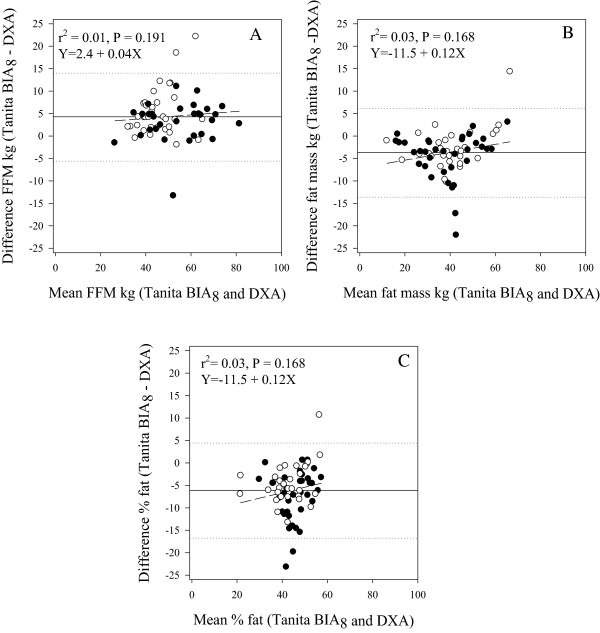
Figure 1.

Mean-vs-difference plots of body composition parameters determined by dual-energy x-ray absorptiometry (DXA), and in-built Tanita BIA 8 equations (n = 66). 1A Fat-free mass. 1B Fat mass. 1C Percentage of body fat. Key ○ Boys ● Girls. ……. Limits of agreement (±1.96 SD) (dotted). ―Bias (solid). ----Line of best fit (short dash).
