
FIG 3.
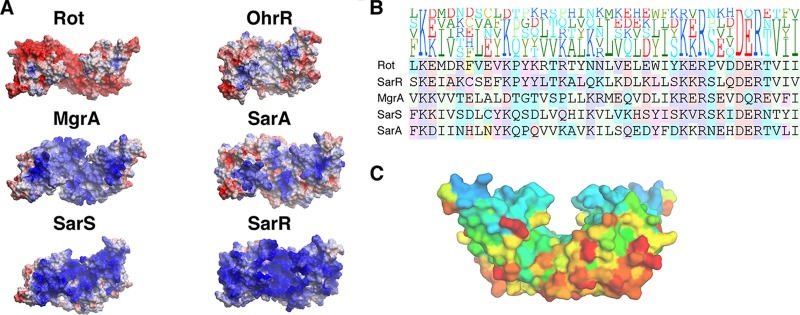
Surface charge distribution and sequence conservation among SarA family members. (A) Electrostatic profiles of SarA family proteins. The electrostatic surface potentials of each protein are colored by charge, with blue representing positive and red representing negative charge. Proteins are oriented with their WHTH facing forward. Proteins are depicted from most to least acidic isoelectric point (left to right, top to bottom). (B) Sequence alignment of WHTH domains of SarA family members. The height of each letter in the top portion of the figure represents the prevalence of that amino acid at the particular position. (C) Sequence conservation of SarA family members projected onto Rot surface. Each residue on the surface of Rot is colored according to sequence conservation, with blue representing the most and red the least conserved. Sequence conservation was defined by alignment generated by BLAST. The figure was generated by the ConSurf program (53).