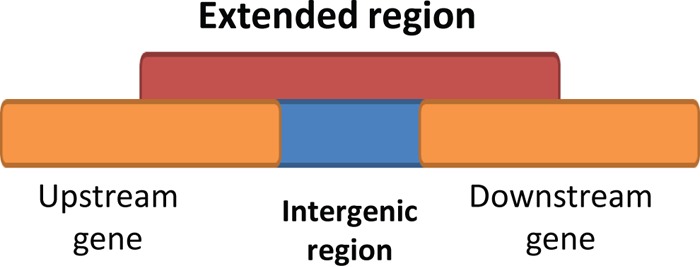
FIG 1.

Extended intergenic region. The orange bars indicate the upstream and downstream protein-coding regions, the blue bar indicates the intergenic region, and the red bar indicates the extended intergenic region, which includes the intergenic region along with a part of the upstream and downstream region that equals the length of the intergenic region. The intergenic regions and extended regions were analyzed with WU-BLAST and compared with each other for conservation-level analysis.
