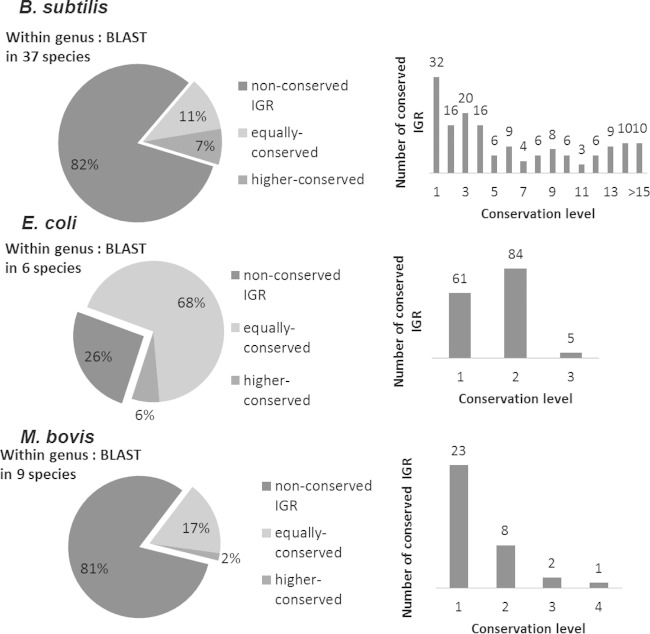
FIG 2.
Conservation patterns of intergenic regions in selected species. The figure shows the conservation level distribution of intergenic regions in three selected species (see Fig. S1 in the supplemental material for all other species). The conservation level is the number of within-genus or outside-genus organisms found to have homology of the intergenic region. The intergenic region would be marked as “nonconserved” if its conservation level is less than that of the extended intergenic region or as “equally conserved” or “more highly conserved” if the conservation level is equal to or higher than that of the extended intergenic region. The pie charts show how conservation levels are distributed in the more highly conserved intergenic regions, and the total numbers of within-genus organisms are shown above them.

