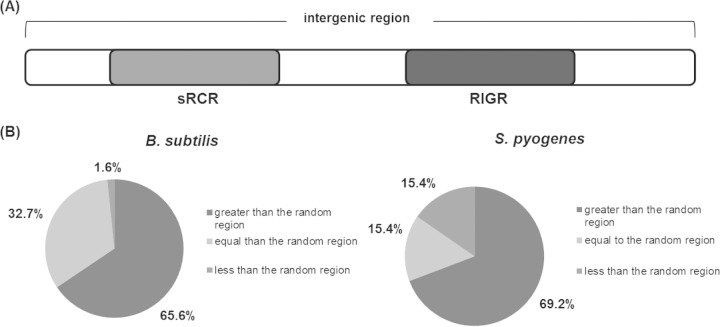
FIG 5.
Illustration of the sRNA-coding region in an intergenic region and comparison of conservation levels. (A) Sketch of an sRNA-coding intergenic region (sRCR) and a randomly selected, nonoverlapping region of the same length as the sRCR in the same intergenic region (RIGR) used for comparison of conservation levels. (B) Comparisons of the conservation levels of sRCRs and corresponding RIGRs. The percentages show how many sRCRs have a conservation level that is greater than, equal to, or lower than that of the respective RIGRs. For instance, 69.2% of the sRCRs have a greater conservation level than the RIGRs, while 15.4% of the sRCRs have a lower conservation level than the respective RIGRs.

