FIG 3.
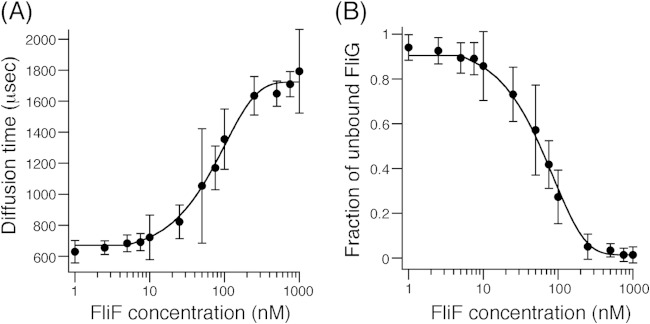
FCS analyses of FliF binding to ATTO633-labeled FliG. (A) Plots of FCS diffusion time against FliF protein concentration. Exponential curve fitting was performed to aid in visualization. A 10 nM sample of ATTO633-labeled FliG was mixed with various concentrations of purified FliF, and diffusion times of labeled FliG particles were obtained by FCS analysis using the MF-20 system. Three independent experiments were performed, and typical data are shown. (B) Plots of the fraction of unbound FliG against the FliF concentration. Two-component analysis was performed for the data set shown in panel A. Exponential curve fitting was performed to aid in visualization. Details are described in Materials and Methods.

