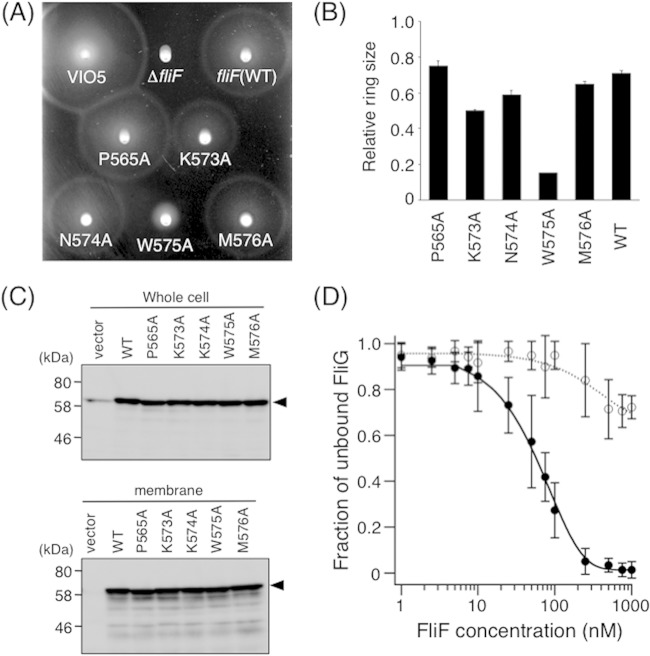
FIG 6.
Alanine-scanning analyses of the C-terminal end of FliF. (A) Motility of cells on soft-agar plates. NMB196 cells expressing mutant FliF proteins were inoculated onto soft-agar plates containing 0.02% arabinose and were incubated at 30°C for 6 h. (B) Relative motility ring sizes of NMB196 (ΔfliF) cells expressing Ala-replaced FliF mutant proteins. Motility on soft-agar plates was analyzed in the presence 0.02% of arabinose, and ring sizes were measured and normalized to those formed by VIO5 cells harboring the vector pTY57. WT, wild type (full-length FliF expressed from plasmid pTY502). (C) Expression of mutant FliF proteins with a single Ala replacement in the C-terminal region. Whole-cell samples (top) and membrane fractions (bottom) of NMB196 (ΔfliF) cells expressing wild-type or mutant FliF proteins from the plasmid were prepared from the same cell cultures, analyzed by SDS-PAGE, and immunoblotted with an anti-FliF antibody. Arrowheads show the position of FliF. The vector was pBAD33. (D) FCS analyses of FliF(W575A) binding to ATTO633-labeled FliG. A total of 10 nM ATTO633-labeled FliG was mixed with various concentrations of purified FliF(W575A), and diffusion times of labeled FliG particles were obtained by FCS analysis using the MF-20 system, as described in the legend to Fig. 3A. Two-component analysis was then performed as described in the legend to Fig. 3B. Three independent experiments were performed, and typical data are shown. Filled circles, full-length FliF (same data as in Fig. 3B); open circles, FliF(W575A). Exponential curve fitting was performed to aid in visualization.

