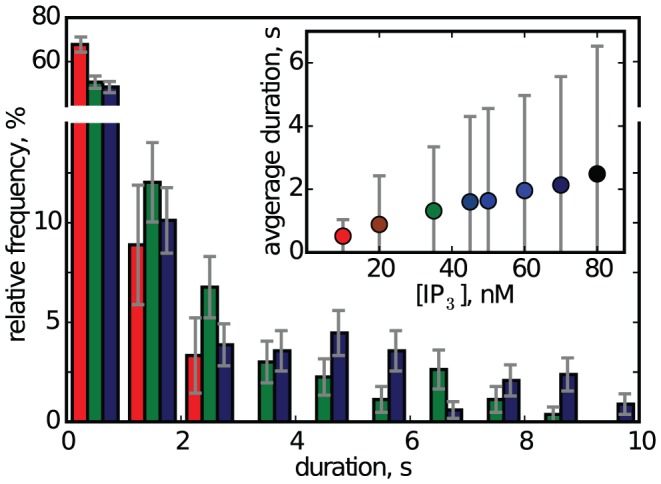
Figure 3. Distribution of event durations for [IP3] of 10 nM (red bars), 35 nM (green bars) and 70 nM (blue bars).

For [IP3] = 10 nM only 3 of 90 events lasted longer than 2 s (3.3%). For [IP3] = 20 nM only 10 of 166 events lasted longer than 3 s (6.0%). For [IP3] = 80 nM, 72 of 309 events lasted longer than 3 s (23%). Error bars denote the sampling error of the histogram. The inset shows the average event duration and its standard deviation.
