
Figure 4. Distribution of the number of activatable channels at the beginning of the events for [IP3] = 10 nM (red bars), 35 nM (green bars) and 75 nM (blue bars).
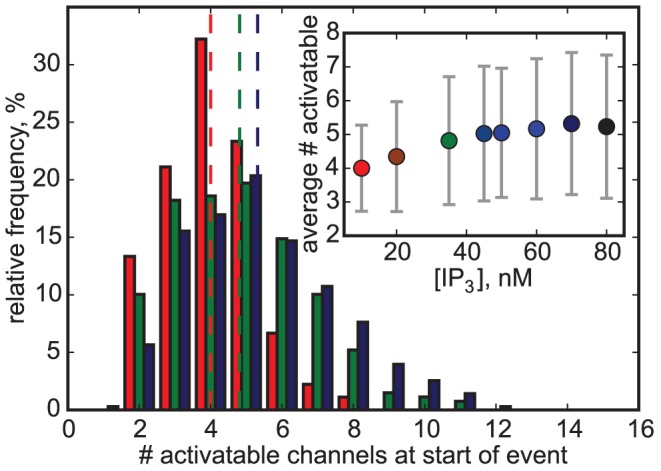
Dashed lines mark the mean value. Inset: The average number of activatable channels at the beginning of an event depends on [IP3]. Vertical bars are standard deviations.