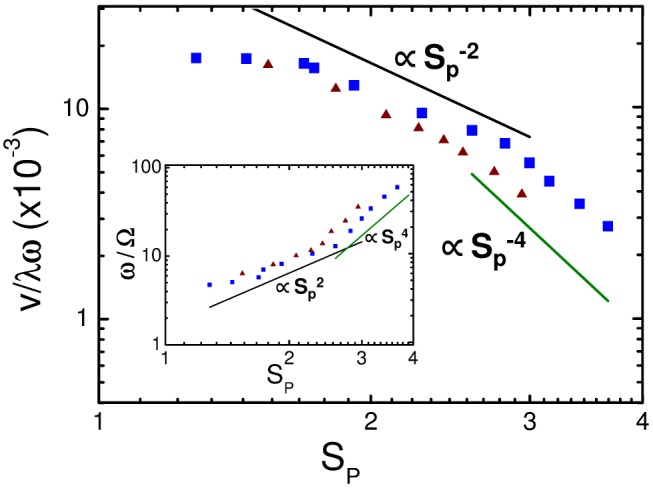
Figure 3. Swimming velocity versus sperm number.

Rescaled swimming velocity  plotted versus sperm number
  (double-logarithmic plot) for to two viscosity values
  (squares) and
  (triangles) given in MPCD units. Inset: Number of flagellar beats per full cell rotation
  versus
  . The solid lines indicate power laws in
  .
.
