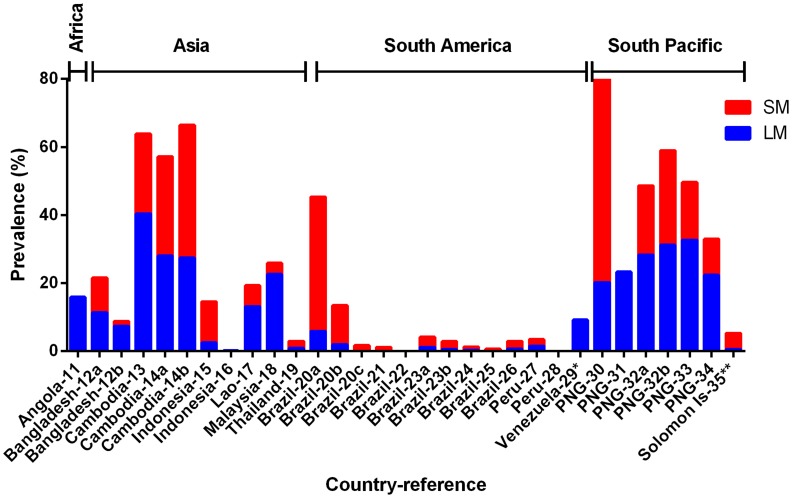
Figure 2. Prevalence of LM (light microscopy, blue bar) and SM (sub-microscopy, red bar) of sympatric P. falciparum in cross-sectional surveys.
Total height of each bar (blue + red) represents the PCR prevalence. Countries where data were collected and their corresponding references (detailed in Table 1) are shown on the x-axis.

