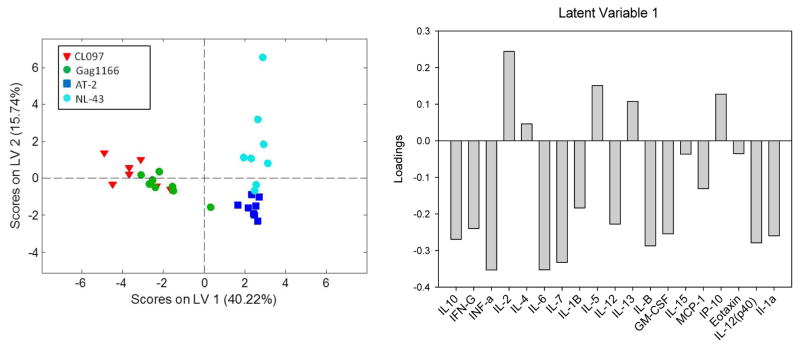
Figure 3. Partial least square discriminant analysis of cytokine profiles following stimulation with TLR Ligands and HIV-1.
A PLSDA score plot (left) indicates 19 cytokine secretion measurements differentiate between TLR (CL097 and ssRNAGag1166) and HIV-1(AT-2 HIV-1 or HIV-1NL43) stimuli (separated by LV1) and also between AT-2 HIV-1 and HIV-1 strain NL-43 stimuli (separated by LV2). A loadings plot (right) illustrates that HIV stimuli (positive scores on LV1) are associated with a profile involving IP-10, IL-2, IL-4, IL-13, and IL-5 compared to TLR stimuli. LV2 (not shown) distinguishes between AT-2 and NL-43 HIV strains.

