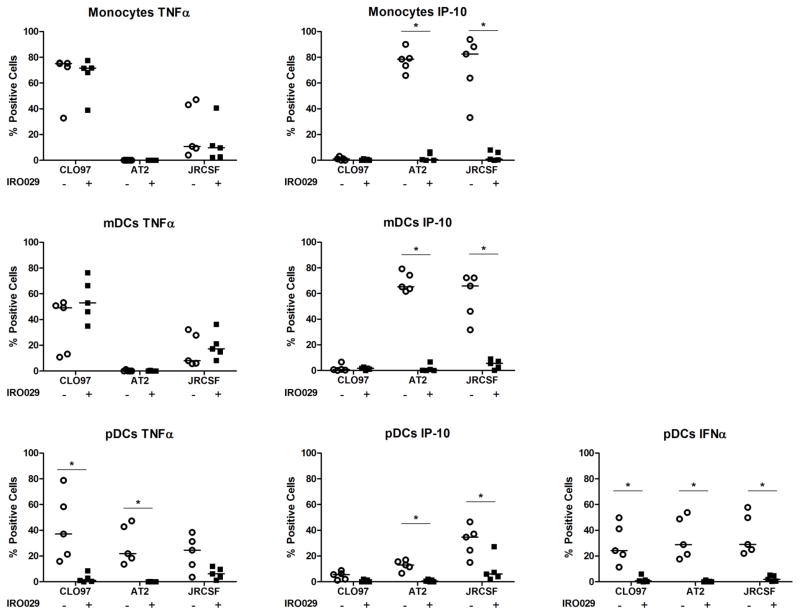
Figure 4. Assessment of monocyte, mDC, and pDC production of TNFα or IP-10 with and without pre-treatment with a TLR7/9 antagonist.
Proportion of monocytes, mDCs, and pDCs that produce TNFα or IP-10 quantified by intracellular cytokine staining in response to CL097, AT-2 HIV-1 or JRCSF with (closed squares) or without (open circles) pre-treatment with a TLR7/9 antagonist. The horizontal lines are the medians. Data are reported following background subtraction. The stated p values were calculated using Mann-Whitney test for non-parametric data. P values were considered significant (*) if less than 0.05.

