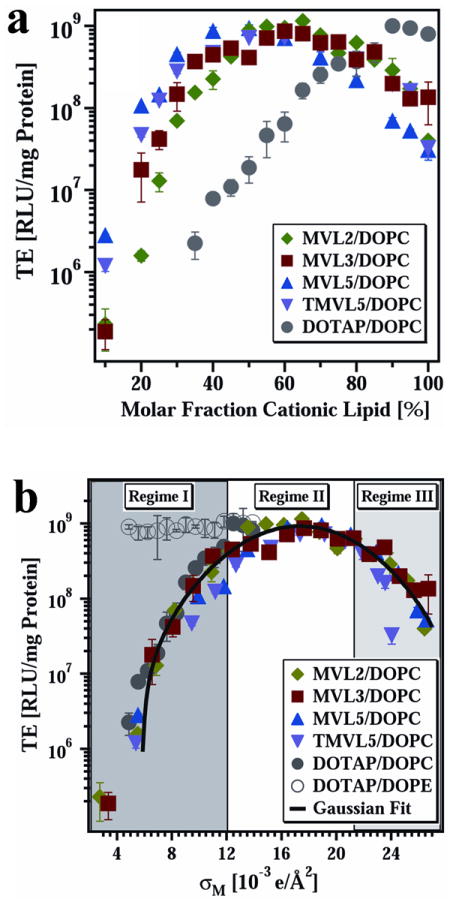
Fig. 3.

(a) Transfection efficiency (TE) as a function of mol% DOPC for DNA complexes prepared with the multivalent lipids MVL2 (green diamonds, valence Z = 2), MVL3 (red squares, valence Z = 3), MVL5 (blue triangles, valence Z = 5), TMVL5 (purple inverted triangles, valence Z = 5), and univalent DOTAP (gray circles, valence Z = 1). All data were taken at cationic lipid/DNA charge ratio ρchg = 2.8. (b) The same TE data as in (a) plotted versus the membrane charge density, σM (defined in the text). The data show that TE of the lamellar LαC complexes describes a universal, bell-shaped curve as a function of σM (the solid line is a Gaussian fit to the data). Significantly, data for DOTAP/DOPE–DNA complexes (gray open circles, HIIC phase) deviate from the universal curve, indicative of a distinctly different transfection mechanism for the inverted hexagonal phase. Three regimes of transfection efficiency are identified as discussed in the text. Reprinted with permission from reference 61. Copyright 2005, John Wiley & Sons.
