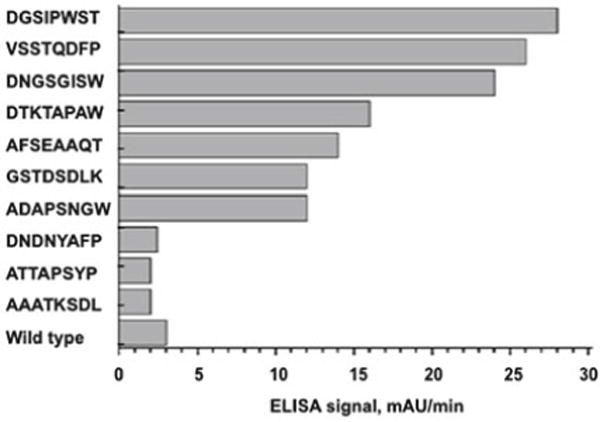
Fig. 2.

Binding of control wild-type phage and affinity-selected phages to SKBR-3 cells evaluated by ELISA [16]. The x-axis shows the absorbance of ELISA signal and the y-axis indicates the affinity selected peptide sequences displayed on the major coat of phage. (Reprinted with permission from Mol Pharm 2010, 7(5): 1629–1642. Copyright 2013 American Chemical Society)
