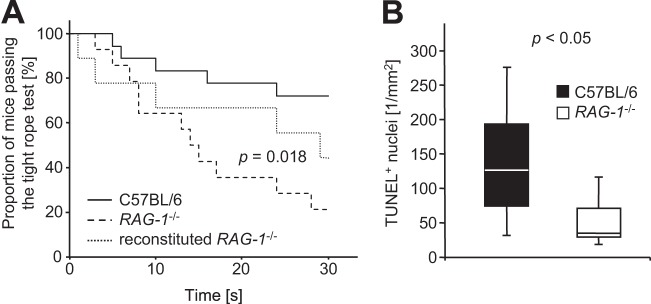
FIG 2.

Impact of RAG-1 deficiency (RAG-1−/−) on clinical impairment (A) and neuronal damage (B) 24 h after intrathecal challenge with Pam3CysSK4. (A) Kaplan-Meyer graph depicting the proportion of mice passing the tightrope test for strength and motor coordination for the given duration of time. Significance was determined using a log-rank test. Control mice (not shown) were able to hold on to the rope for at least 30 s. (B) Density of TUNEL-positive nuclei in the dentate gyrus. Graphs depict the median, minimum and maximum values, as well as the 25th and 75th percentiles. Significance was determined using a Student t test.
