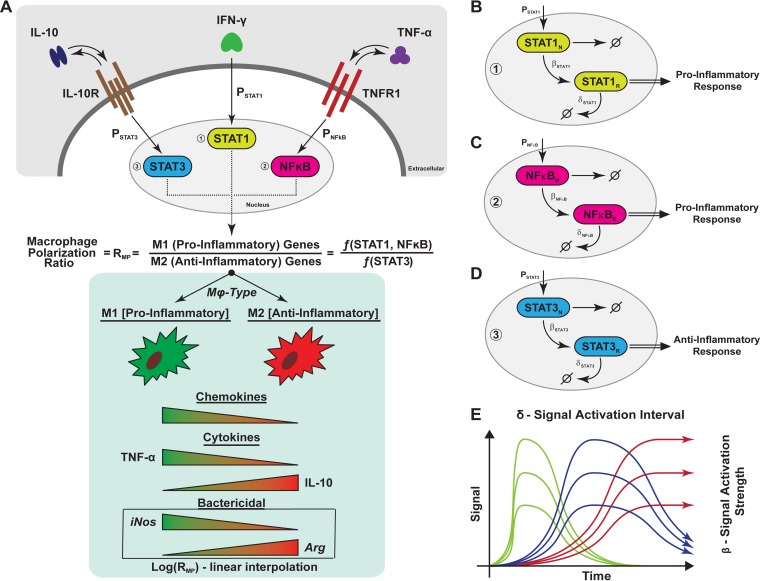
FIG 1.
Schematic representation of macrophage polarization and gene expression dynamics captured in the agent-based model. (A) Simplified cartoon that represents the macrophage signaling cascade of the three pathways used in the study to capture M1 (proinflammatory) and M2 (anti-inflammatory) cues. Each signal was quantified and used to calculate a ratio that was then used to modulate several immune functions of the macrophage (chemokine and cytokine [TNF, IL-10] synthesis, bacterial killing). The modulation is implemented as a linear interpolation (the value of the ratio is normalized and multiplied by the parameter value regulating the correspondent immune function). (B, C, and D) Representation of how gene transcription dynamics is modeled through the three pathways (STAT1, STAT3, and NF-κB, respectively). For each of the pathways, we have a nuclear species state (denoted with N) and a response species state (denoted with R). The details are given in Materials and Methods. (E) Different gene transcription dynamic regimes (fast [green], intermediate [blue], and slow [red]) that are recapitulated by our in silico model, for each species. The two parameters whose values varied were the signal degradation time (or length [δ]) and the response/signal strength (β) of the response.

