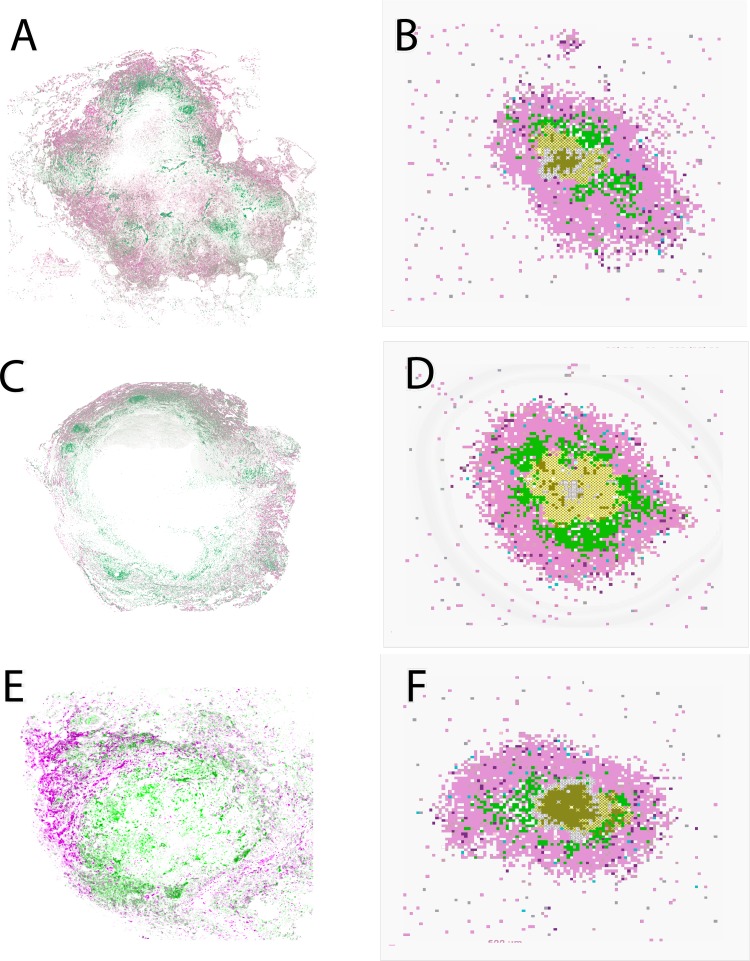
FIG 2.
Comparison between granulomas from nonhuman primates and in silico granulomas generated by our model. (A, C, and E) Stains of 3 different granulomas for p-STAT3 (pink) and p-STAT1 (green). Green, M1-like macrophages; pink/purple, M2-like macrophages. (B, D, and F) Computer model snapshots at day 200 postinfection. As described in the Fig. 1 legend and in Materials and Methods, macrophages were classified as representing either an M1 (proinflammatory) or an M2 (anti-inflammatory) phenotype based on the polarization ratio. We label a macrophage as M1 (green) if its polarization ratio is greater than 1 and M2 (pink) if it is smaller than 1. Other cell types are as follows: effector lymphocytes (proinflammatory IFN-γ-producing T cells, light pink; cytotoxic T cell, purple; regulatory T cells, light blue), extracellular bacteria (olive green), vascular sources (gray), and necrotic spots (center; white x's). The three granuloma snapshots are generated by the in silico model with three different parameter settings (chosen from our uncertainty analysis simulations).

