FIG 3.
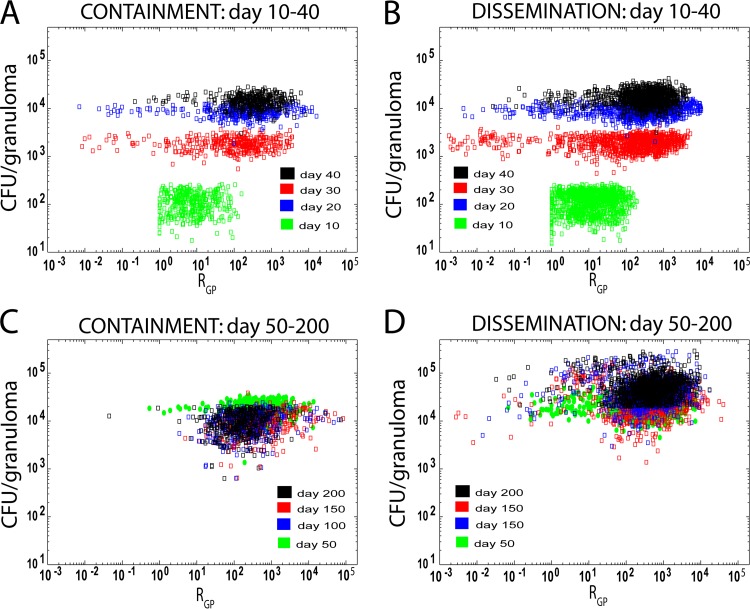
CFU/granuloma versus granuloma polarization ratio (RGP), calculated as described in Materials and Methods. Each point represents an in silico granuloma at different time points during infection. The x axis shows the RGP versus its corresponding CFU value (y axis). Both axes are shown on a log scale. The data set shown is from an LHS of sample size 1,500 (n = 500 with 3 replications), with parameter ranges given in Table 1. Time is represented by labeling the data with different colors (see key in figure). The panels in the left column represent contained granulomas (panels A and C [labeled “containment”]). The panels in the right column represent granulomas that are not contained (panels B and D [labeled “dissemination”]). The classification distinguishing between those that are and those that not contained is based on the total bacterial load per granuloma, which falls below 2 × 10⁴ after day 200 postinfection. Panels A and B track granulomas from day 10 to 40. Panels C and D track granulomas from day 50 to 200.

