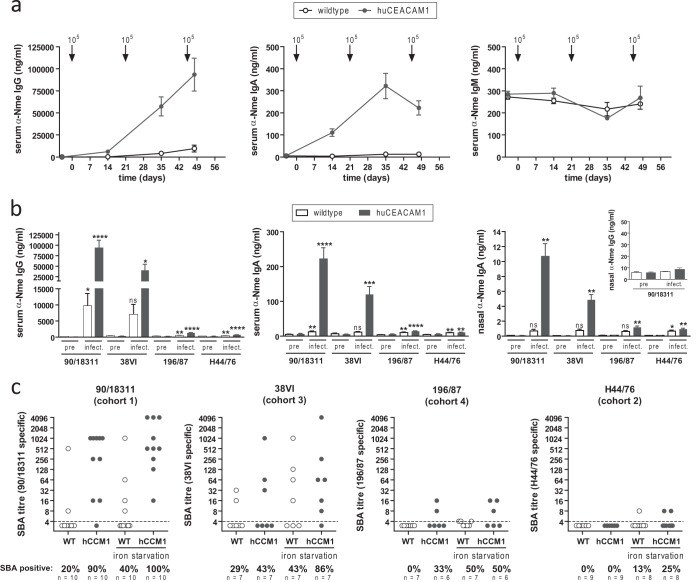
FIG 5.
Cross-reactive antibody responses in 90/18311-infected mice. (a) Time course of generation of specific anti-N. meningitidis serum IgG (left), IgA (middle), and IgM (right) in serum samples obtained from mouse cohorts identical to those in Fig. 4c, analyzed by whole-cell ELISAs using plates coated with strain 90/18311. Arrows indicate time points of intranasal infection (also shown in Fig. 4a). Data are expressed as means ± standard errors of the means of values obtained from individual serum samples. (b) Cross-reactive titers of serum IgG (left), serum IgA (middle), nasal IgA (right), and nasal IgG (inset), comparing terminal serum samples by whole-cell ELISAs using microtiter plates coated with N. meningitidis strains as indicated below graphs. Data are expressed as means ± standard errors of the means. Statistical analysis was performed using GraphPad Prism software. ns, not significant; *, P < 0.05; **, P < 0.005; ***, P < 0.0005; ****, P < 0.0001, using Student‘s t test comparing serum samples after infection with preimmune serum samples of the same cohorts. (c) Serum bactericidal antibody (SBA) titers in individual serum samples. For each serum sample, the N. meningitidis strain used for the SBA assay (indicated above graphs) was identical to that used for the terminal challenge of the corresponding cohorts. As indicated below the x axis, N. meningitidis test strains were exposed, or not, to iron starvation conditions by 500 μM deferoxamine mesylate to mimic in vivo stress conditions.

