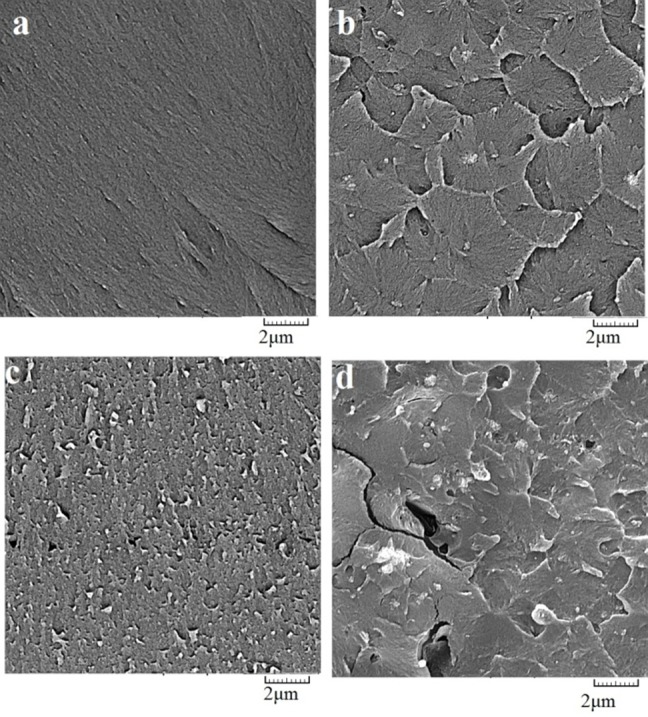
Figure 3.

SEM images taken from cross-section of (a) control sample and nanocomposite containing TiO2 nanoparticles with (b) 0.5wt% (c) 1wt% , and (d) 2wt%.

SEM images taken from cross-section of (a) control sample and nanocomposite containing TiO2 nanoparticles with (b) 0.5wt% (c) 1wt% , and (d) 2wt%.