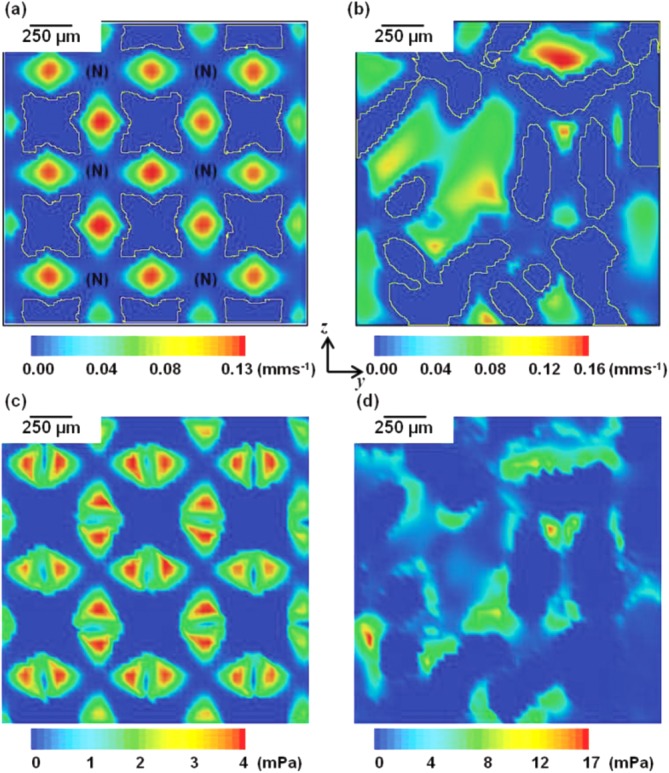
FIGURE 4.

(a,b) 2D cross-sectional views of local velocity distributions in the regular and 30% randomized structures. (c,d) 2D cross-sectional views of local shear distributions in the two structures (inflow velocity: 0.02 mm/s). [Color figure can be viewed in the online issue, which is available at http://wileyonlinelibrary.com.]
