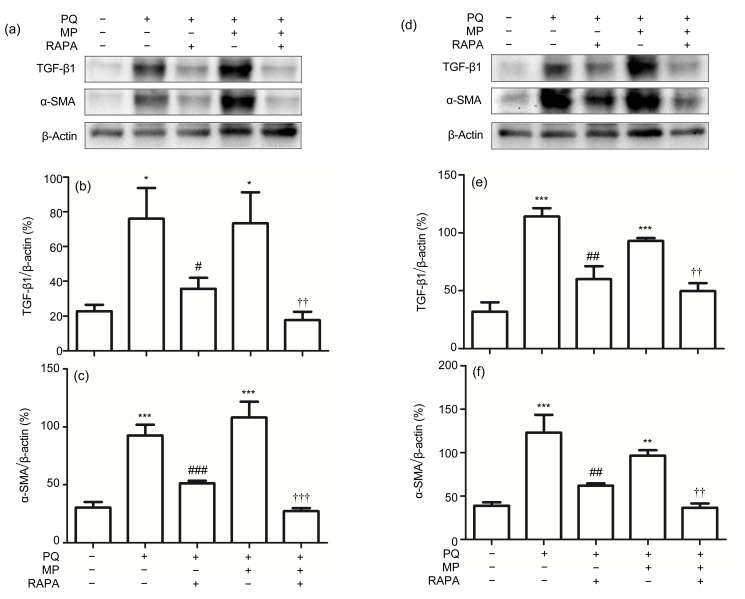
Fig. 6.
Protein levels of TGF-β1 and α-SMA in lung tissues
The protein levels of TGF-β1 and α-SMA were significantly reduced by RAPA treatment for 14 d (a–c) and 28 d (d–f), respectively. Data are expressed as mean±SEM (n=6). * P<0.05, ** P<0.01, *** P<0.001, compared with control; # P<0.05, ## P<0.01, ### P<0.001, compared with PQ group; †† P<0.01, ††† P<0.001, compared with PQ+MP group. The blots with anti-TGF-β1 antibody and anti-α-SMA antibody are shown in (a) and (d), respectively, and densitometric analysis normalized against β-actin is shown in (b), (c), (e), and (f)

