Figure 3.

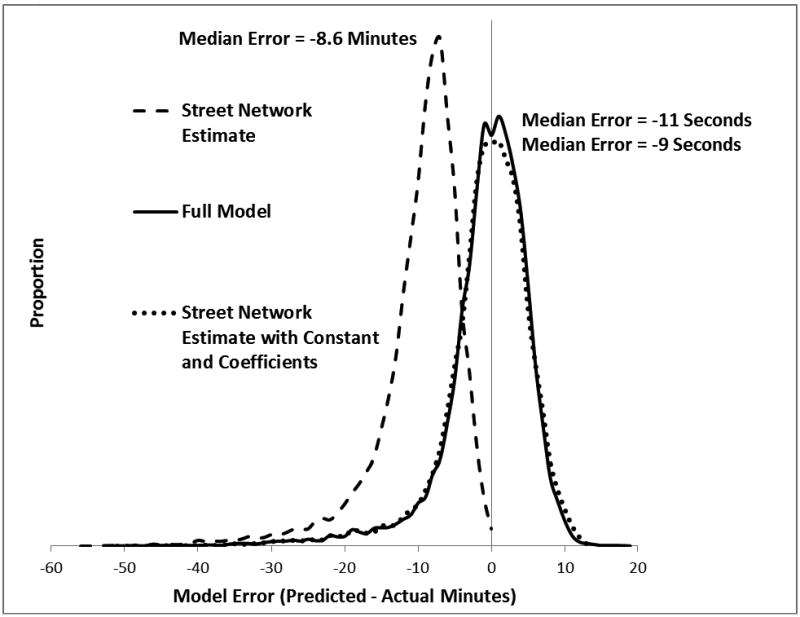
Distribution of error in predicted transport time for three models. Error is shown as predicted minus actual, so negative numbers signify the model underestimating transport time (patient arriving after the predicted time).

Distribution of error in predicted transport time for three models. Error is shown as predicted minus actual, so negative numbers signify the model underestimating transport time (patient arriving after the predicted time).