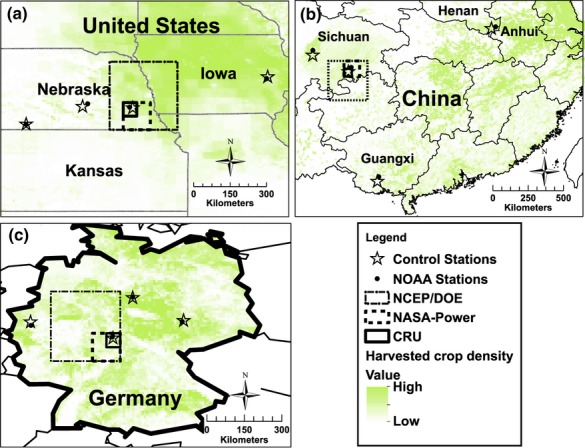
Fig 1.

Locations of control weather stations, NOAA weather stations and size of NCEP/DOE, NASA-POWER, and Climate Research Unit (CRU) grids (shown for one of the control weather data sites) for (a) maize in the USA, (b) rice in China, and (c) wheat in Germany. Grid size is: 2.5° × 2.5° for NCEP, 1.0° × 1.0° for NASA, and 0.5° × 0.5° for CRU. Harvested crop area density is indicated by shaded areas on each map.
