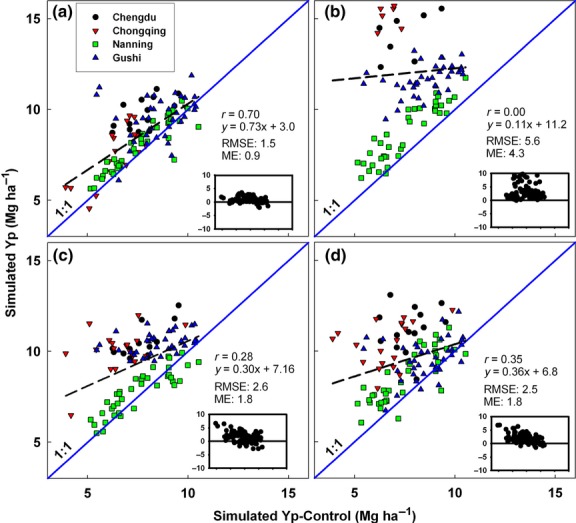
Fig 3.

Simulated rice Yp across four sites in China using weather data from NOAA-SR (a), NCEP (b), Climate Research Unit (c), and NASA (d) plotted against simulated Yp based on a control weather database. Insets show deviations of points from the 1:1 line for each site and year for which yield was simulated with GWD or NOAA data. RMSE and mean error units are in Mg ha−1. Symbols represent different locations and cropping systems within each location. Site elevation (m) is 506 (Chengdu), 305 (Chongqing), 38 (Gushi), and 124 (Nanning).
