
Figure 1.
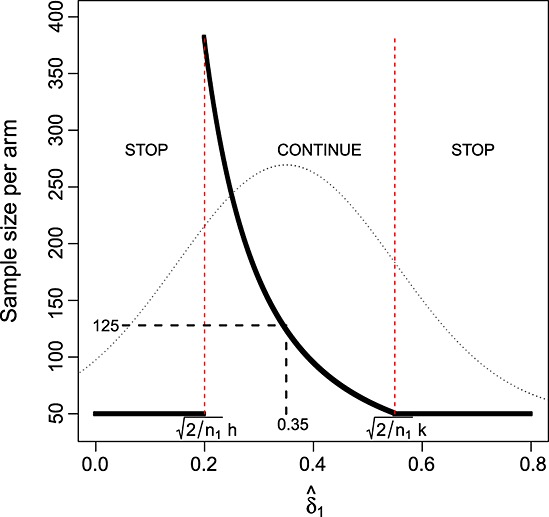
Stage one effect estimate versus total sample size using design 1. Dotted line shows the distribution of the estimate  when δ = 0.35.
Official websites use .gov
A
.gov website belongs to an official
government organization in the United States.
Secure .gov websites use HTTPS
A lock (
) or https:// means you've safely
connected to the .gov website. Share sensitive
information only on official, secure websites.
Stage one effect estimate versus total sample size using design 1. Dotted line shows the distribution of the estimate when δ = 0.35.