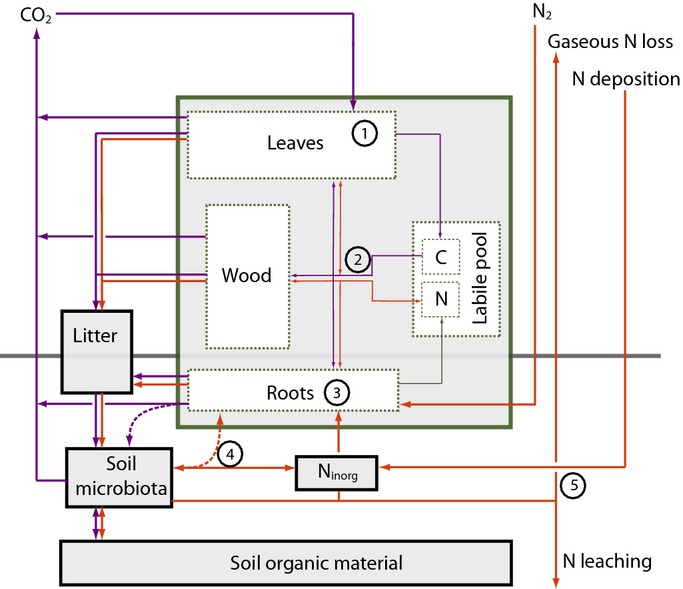
Figure 1.

Conceptual diagram of the major nitrogen (N) and carbon (C) flows and stores in a terrestrial ecosystem. Blue arrows denote C fluxes and red arrows N fluxes between major plant compartments (green) and soil pools (black). Numbers 1–5 mark important C–N cycle linkages as described in the Evaluation framework section: 1, N-based gross primary production (GPPN): the return of C assimilates per unit canopy N Eqn 1; 2, whole-plant nitrogen-use efficiency (NUE): the total amount of foliar, root and woody production per unit of N taken up by plants; this process depends on the allocation of growth between different plant compartments (e.g. leaves, fine roots and wood) and the C : N stoichiometry of each compartment Eqn 2; 3, plant N uptake (fNup): the capacity of the plants to take up N from the soil Eqn 4. The plant-available soil N is determined by two factors: 4, net N mineralization (fNmin): the amount of N liberated from organic material through decomposition, which varies with microbial activity and litter quality Eqn 6; and 5, the net ecosystem nitrogen exchange (NNE): based on N inputs from biological N fixation (fNfix) and atmospheric deposition (fNdep) and N losses from the ecosystem as a result of leaching to groundwater (fNleach) and gaseous emission (fNgas) Eqn 5. As an emergent property, the net amount of C that can be stored in an ecosystem following an increase in CO2 depends on the elevated atmospheric [CO2] (eCO2) effect on the ecosystem's N balance and the whole-ecosystem stoichiometry, which, in turn, depends on the change in the C : N stoichiometry of vegetation and soil, as well as the partitioning of N between vegetation and soil (Rastetter et al., 1992).
