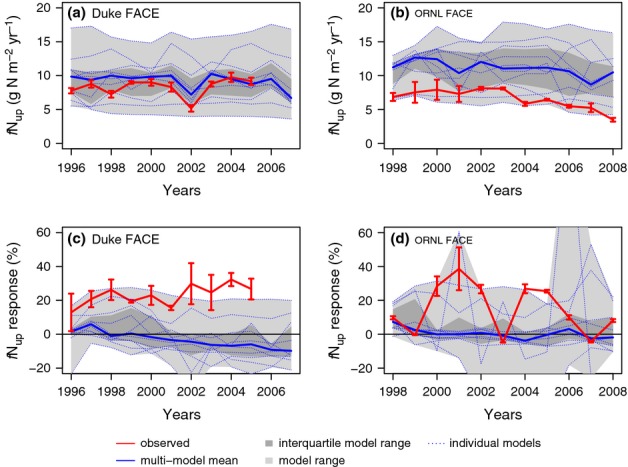
Figure 3.

Ambient plant nitrogen (N) uptake (fNup; a, b) and its response to elevated CO2 (c, d) at the Duke (a, c) and Oak Ridge National Laboratory (ORNL) (b, d) Free-Air CO2 Enrichment (FACE) experiments. The observations are across-plot averages, and the error bars denote ± 1SE.
