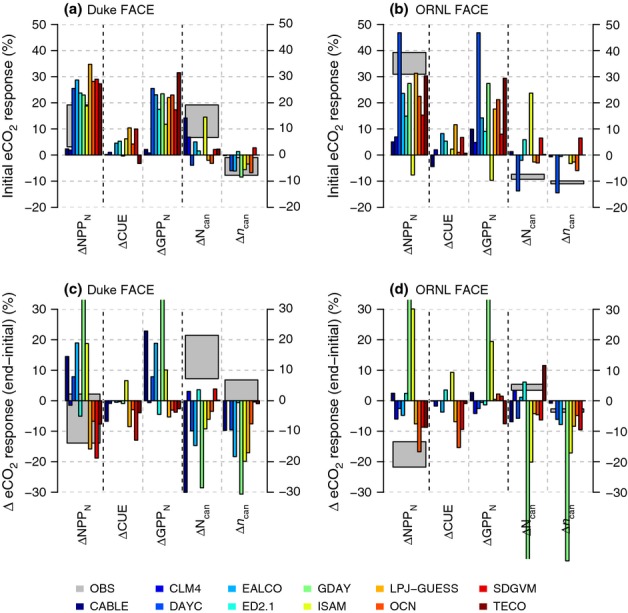
Figure 6.

First year response of nitrogen (N)-based net primary production (NPPN) to elevated atmospheric [CO2] (eCO2) (a, b) and the change between the first year and the final 5 yr of the experiment (c, d) at the Duke and Oak Ridge National Laboratory (ORNL) Free-Air CO2 Enrichment (FACE) sites, respectively, as well as the response of plant carbon (C)-use efficiency (CUE), N-based gross primary production (GPPN) and canopy N, expressed as total canopy N (Ncan) and foliar N concentration (ncan). The grey boxes denote the mean observed eCO2 response ± 1SE, where observations corresponding to model output are available.
