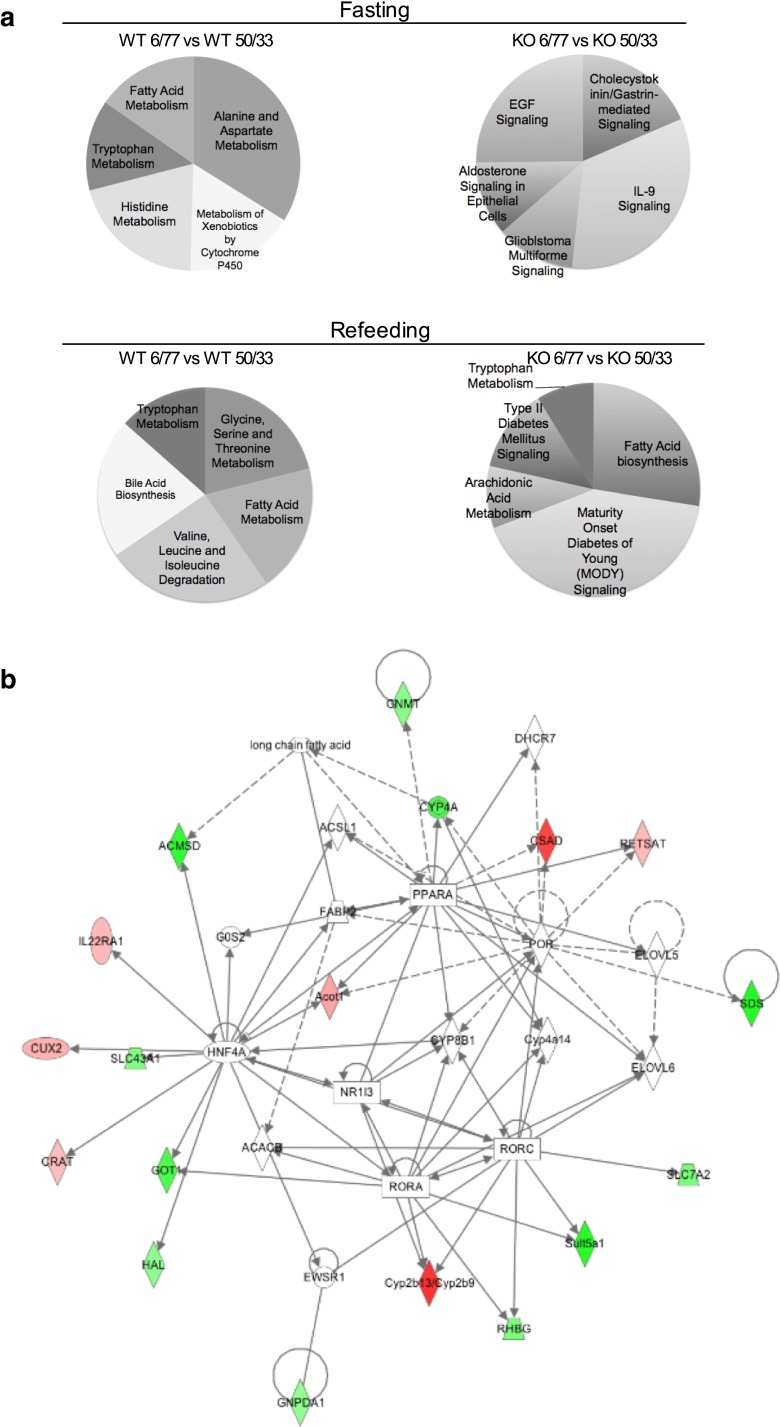
Fig. 3.
Biological pathways and the functional network associated with PPARα dependent on DP/DCH intake. a Top canonical pathways in Ppara-null and WT mice fed 6/77 versus 50/33 % diets. Comparisons were made using the genes that showed differential expression in the microarray analysis. b Functional network related to AA and lipid metabolism. The network was constructed taking into consideration those genes that were differentially expressed due to changes in the DP/DCH ratio. Color-coding: red, up-regulated genes; green, down-regulated genes; the intensity of the colors indicates the degree of up- or down-regulation. Shape-coding: rectangle, ligand-dependent nuclear receptor; oval, transcription regulator; rhombus, enzyme; circle, others

