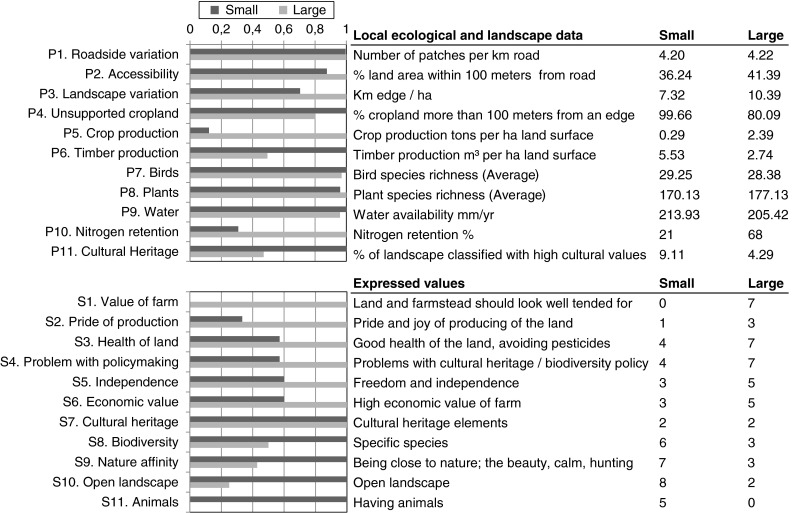
Fig. 2.

Comparisons between low- and high-intensity farms. The bars to the left shows normalized differences with the highest value for each variable set to 1. The figures in the two right-most columns show the actual values for each indicator. The P variables are either measured at the near-farmhouse scale or at the landscape scale. All S variables are measured at the farm level
