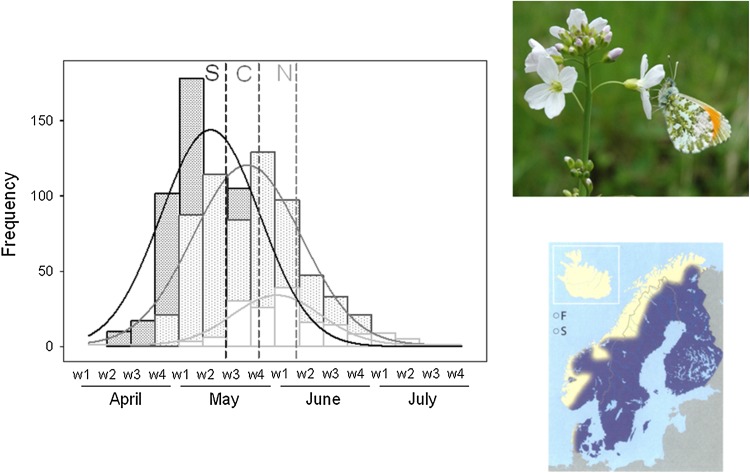
Fig. 1.
Anthocharis cardamines flying period and observation frequency (number of regional observations) in south (black line), central (dark gray line), and north (gray line) regions according to the 2010 “species gateway” data base (http://www.artportalen.se). Data were fitted to a Gaussian curve. Vertical dashed lines indicate the starting date of our samplings. Distribution map: Eliasson et al. (2005); Photograph by Christer Wiklund shows a male A. cardamines nectaring on Cardamine pratensis

