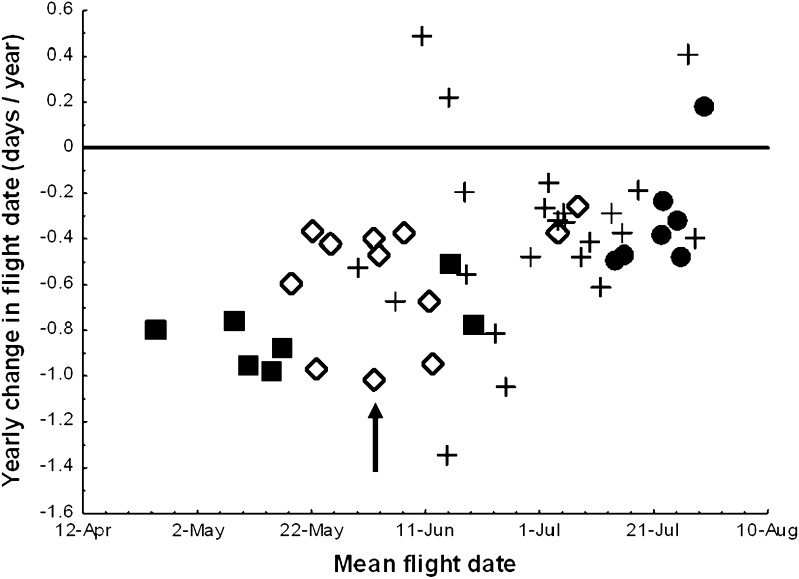
Fig. 2.
The relationship between mean flight date and yearly change in flight date in a set of butterfly species in Sweden during 1991–2010, r = 0.49, P < 0.001 (cf. Table 1 in Karlsson 2013), symbols represent overwintering stage; squares adult, diamonds pupal, crosses larval, and dots egg. The focal butterfly species, Anthocharis cardamines, in this study is marked with an arrow. The different overwintering stages differ significantly in respect to degree of yearly change in flight date, F(3,62) = 5.779, P = 0.0015. Redrawn from Karlsson (2013)

