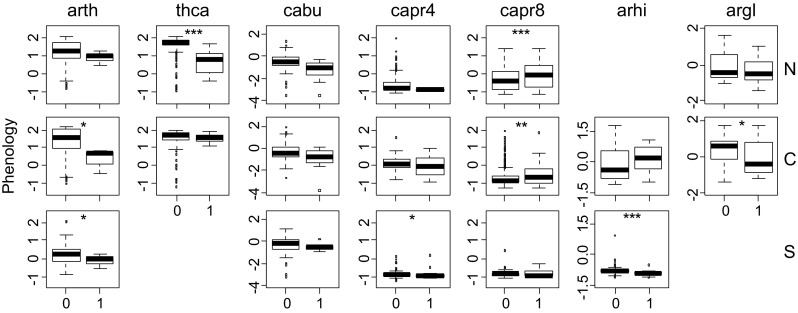
Fig. 6.

Box-plots showing the mean phenology (second axis from a PCA, see text) for plant individuals of seven different species and from three different regions that were either oviposited on by the butterfly Anthocharis cardamines (1) or that escaped attack (0). The seven host plant species were arth = Arabidopsis thaliana), thca = Thlaspi caerulescens, cabu = Capsella bursa-pastoris, capr4 = Cardamine pratensis), capr8 = Cardamine paludosa, arhi = Arabis hirsuta, and argl = Arabis glabra. The three regions were: south (S), central (C), and north (N). Significant differences between groups are indicated by asterisks (*P ≤ 0.05, **P ≤ 0.01, ***P ≤ 0.001). Note that scales differ among species
