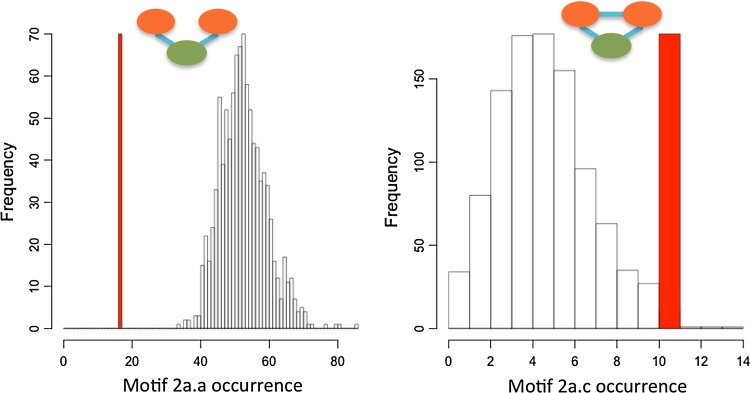
Fig. 5.
The figure shows the two simplest motifs (2a.a and 2a.c) and their frequency distribution when observed in 1000 random simulations. The red bar indicates the single frequency value (bar height only ensures visibility) that was observed for the ecological parameters of 3 ha and 13 km (Table 2). The bar situated to the left of the random distribution indicates that the open motif 2a.a is less frequent that would be expected if randomly assembled. The number of standard deviations (5.3 for 2a.a, 2.7 for 2a.c) reflects the strength of this pattern

