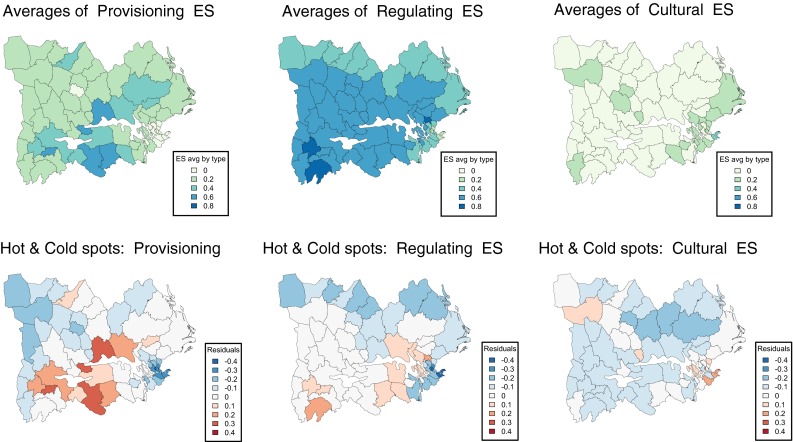
Fig. 4.

Hot and cold spots for types of ES (provisioning, regulating, and cultural) across the study area (lower three figures). Hot spots (represented by an increasing gradient of red) are municipalities with particularly high production of a given type of service, while cold spots (represented by a decreasing gradient of blue) are municipalities where the production of a given type of service is particularly low. Average values of the three ES categories are shown in the upper three figures
