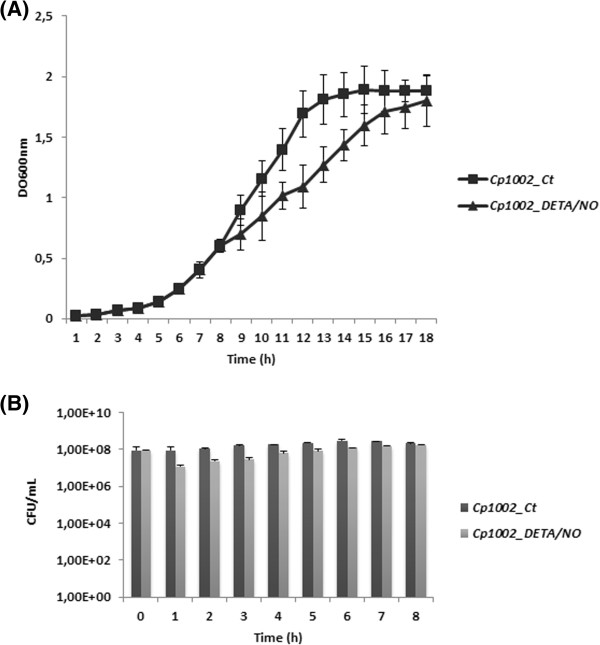
Figure 1.

Growth and survival profile of C. pseudotuberculosis during NO exposure. (A) Growth of C. pseudotuberculosis after 10 h exposure to 0.5 mM DETA/NO. (B) Survival of C. pseudotuberculosis evaluated by colony forming units. The results shown in A and B represent an average of three independent experiments.
