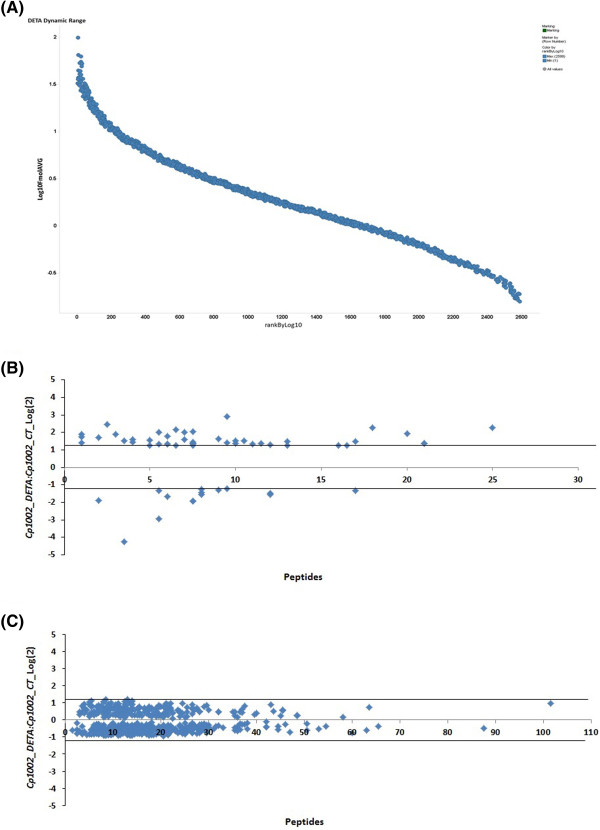
Figure 2.

2D nanoUPLC HDMSE analysis showing: (A) Dynamic range of the method based on protein abundance estimates, data points derived from LC-HDMS E analysis. (B and C) Proteins that were significantly differentially-regulated during NO exposure. The distribution of identified proteins with p < 0.05, and differentially-regulated proteins with an I:C log2 ratio < 1.2 in relation to the number of peptides identified for each protein. (B) Proteins with p < 0.05 and an I:C log2 ratio < 1.2. (C) Proteins with p < 0.05 and an I:C log2 ratio > 1.2.
