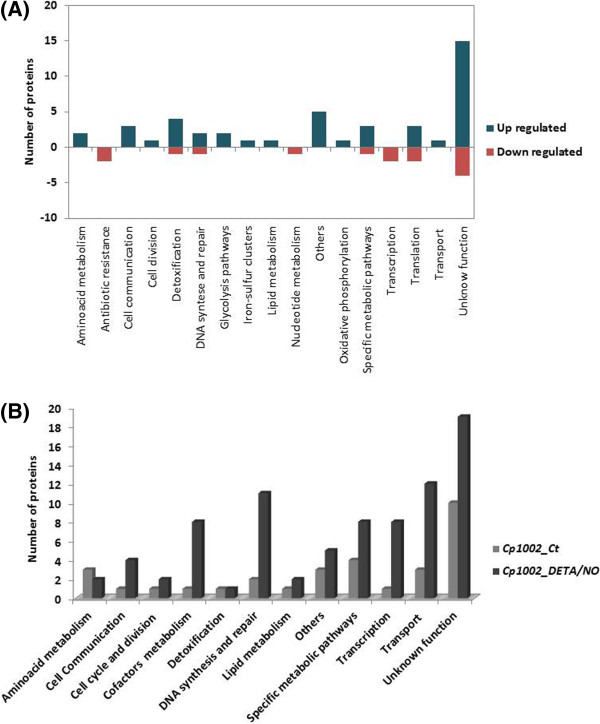
Figure 4.

Comparison of biological processes between control and DETA/NO conditions. A representation of the biological processes in relation to a set list of proteins identified as (A) differentially-regulated in DETA/NO-stressed cells and (B) comparison of exclusive biological process between the two test conditions.
