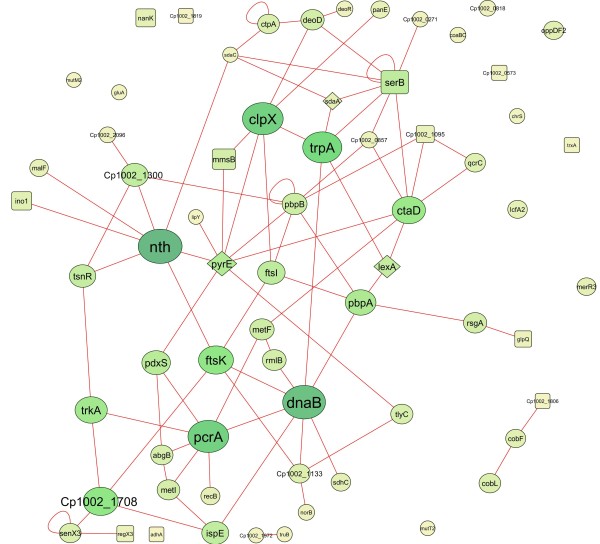
Figure 6.

Protein-protein interactions. Protein-protein interactions of the proteins identified in DETA/NO-exposed cells. Exclusive proteome, circle; up-regulated, square; and down-regulated, rhombus. The sizes of the nodes represent the degree of interaction for each gene/protein; the major nodes demonstrate greater interactions. The colors of nodes and lines are in an increasing gradient scale from yellow to green to blue. The networks were visualized using Cytoscape.
